

Dear Gold Digger,
Two documents came out of Washington on Wednesday.
Everybody read the first one. The July FOMC minutes landed at 2 p.m., and the financial press had its headline inside of four minutes: Kevin Warsh’s Fed is still leaning hawkish. Three regional presidents — Hammack, Kashkari, and Logan — had already dissented in favor of a hike at the July meeting. The vote was 9–3. The minutes added that “several participants” wanted 25 basis points more.
Almost nobody read the second one.
It was a Treasury press release. No press conference, no anchor desk, no ticker crawl. It announced that starting September 9, the Treasury is roughly doubling the size of its buyback operations at the long end of the curve — lifting the per-operation cap from $2 billion to at least $4 billion in both the 10-to-20-year and 20-to-30-year buckets.
The Fed spent Wednesday debating whether to tighten.
The Treasury spent Wednesday easing.
Back on July 23, when I showed you gold miners scraping a 7.69% reading on the Bullish Percent Index, I told you the crowd had positioned itself entirely around the Fed’s calendar — and that the Fed’s calendar was going to be the least important thing on the page. Wednesday is what I meant.
Here’s Why That Distinction Matters Less Than You’d Think
A Treasury buyback works like this, and it’s worth walking through because the mechanism is the whole story.
The Treasury sells short-dated bills. It takes that cash and buys back long-dated bonds — the 20s and 30s that dealers are choking on. Net debt outstanding doesn’t change by a dollar. The Fed’s balance sheet doesn’t move. Technically, nothing has been printed.
What has changed is that the long end of the Treasury market now has a scheduled, price-insensitive buyer showing up twice a month with a bigger checkbook.
Ask yourself what that is, if not easing.
The timing isn’t subtle either. On Tuesday, the 30-year Treasury yield topped 5.33% intraday — a 19-year high, the most since 2007 — and closed at 5.28%. On Wednesday, Treasury announced the bigger buybacks. The 30-year closed at 5.19%.
Charlie Morris over at ByteTree put it about as plainly as it can be put this week: gold smells QE. I’d go one step further. Gold doesn’t need the acronym. It just needs a government that has run out of tolerance for its own borrowing costs.
The Number the Press Release Didn’t Print
Now here’s the part I found genuinely startling when I pulled the raw operation data off the Treasury’s own API.
The Treasury has run 22 long-end buyback operations in 2026. Twenty-one of them hit the cap. Not “most.” All but one — and the exception was the March 19 operation, where Treasury took just $205 million against $36 billion of paper dealers were trying to hand over.
And look at how badly they were oversubscribed. On August 18, Treasury offered to buy $2 billion of 20-to-30-year paper. Dealers tendered $19.9 billion. On July 16, same bucket, same $2 billion on offer — dealers tendered $30.5 billion.
Think about that for a second… At the July operation, demand for the exit was more than 15 times the size of the door.
That is not a market with a healthy appetite for 30-year U.S. government debt. That’s akin to a fire escape with a line out front.
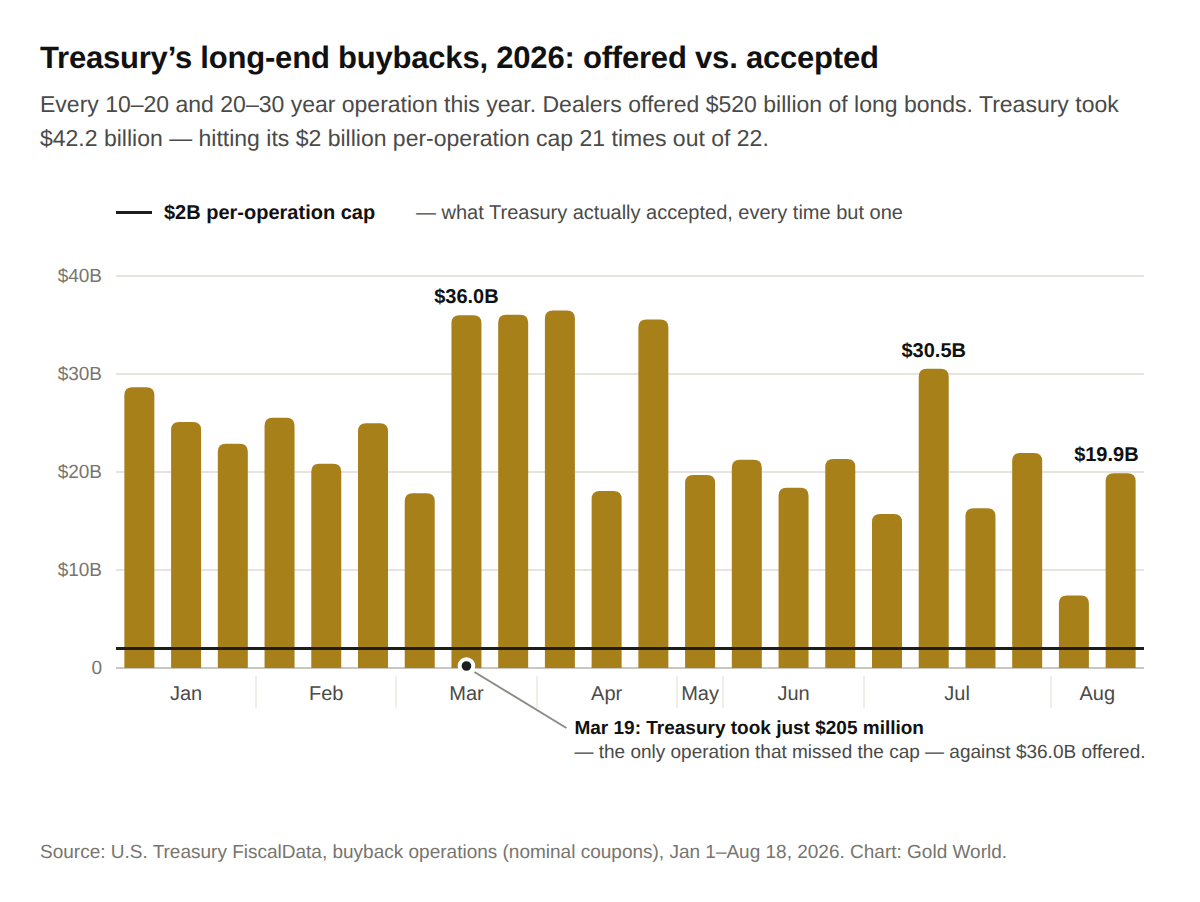
So Treasury made the door wider. Next long-end operations: September 10 and September 24.
And the Reason They Have To
On Monday, total U.S. public debt outstanding crossed $40 trillion for the first time.
Not “approached.” Crossed. The Treasury’s own Debt to the Penny tally put it at $40,047,425,768,420.22 as of August 18. Brian wrote you Monday citing $39.9 trillion, straight off the Treasury’s own tally from August 12. Six days later it had a four in front of it.
The debt is compounding at 7.8% a year — nearly $8 billion a day, every day, weekends included. Morris runs the same math a different way: 8.6% annual growth since the pandemic against nominal GDP growing 6.5%. There is no version of that arithmetic that resolves on its own.
And the refinancing wall is the part nobody at a cocktail party wants to hear about. A government that borrows at 5.3% on the long end instead of 4.9% doesn’t just pay a little more — it pays a little more on trillions, forever, compounding into a budget line that crowds out everything else.
Which is exactly why Treasury is now buying its own long bonds in bulk.
The Scale Check Nobody Runs
Here’s where I want to leave the news and do some math, because the ratio is the actual insight and it’s the sort of thing that never makes it onto CNBC.
Forget gold’s price for a minute. Look at gold’s size.
The World Gold Council puts the total above-ground gold stock at 220,700 tonnes as of the end of last year. At this morning’s spot price of about $4,530 an ounce, every ounce of gold ever pulled out of the ground — jewelry, coins, bars, central bank vaults, all of it — is worth somewhere near $32 trillion.
U.S. Treasury debt held by the public: $32.27 trillion.
Those are the same number.
All the gold on Earth is now worth roughly one-for-one against the publicly held debt of the United States. Against total federal debt including intragovernmental holdings, gold sits at about 80% of face value. Morris runs it against the market value of that debt instead and gets 77% — different denominator, same message. His note is that this ratio has cleared 100% more than once.
Now run the same math against stocks. U.S. equities are worth somewhere in the neighborhood of $78 trillion, which puts all the world’s gold at roughly 40% of the American stock market. Morris pegs it at 37%. Call it two-fifths and move on.
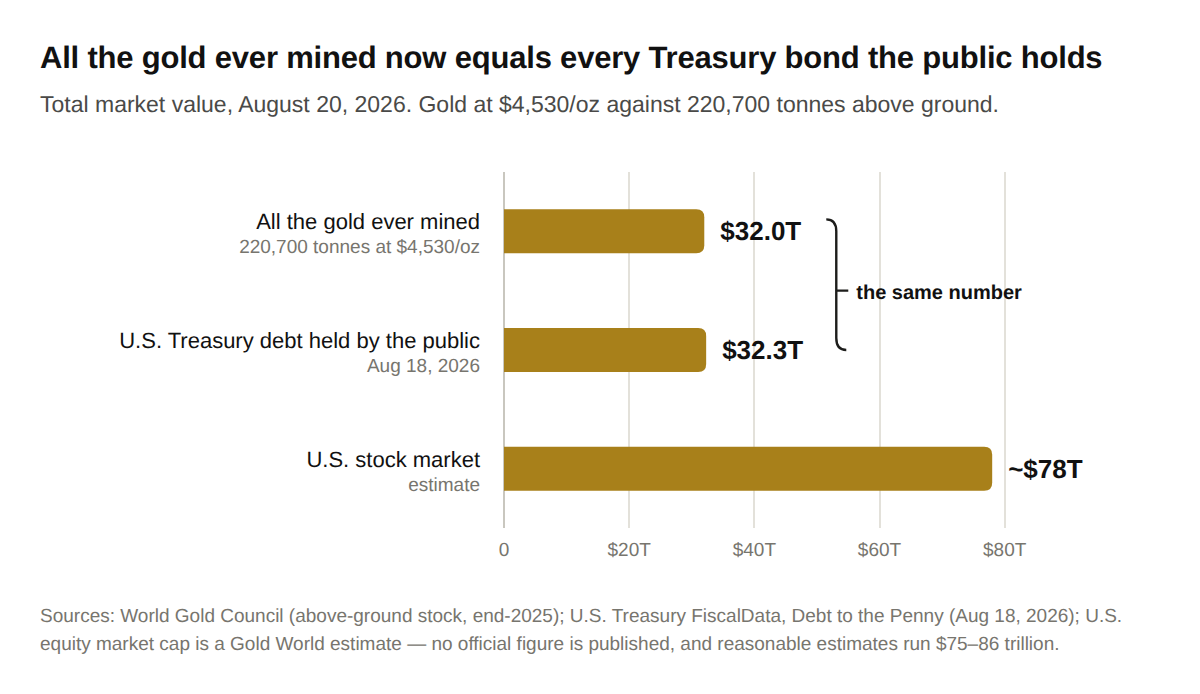
That sounds like a lot until you learn where that ratio has gone before. Morris’s estimate is that at the peaks of the 1930s and 1970s monetary crises, the world’s gold was worth something like 1.6 times the entire U.S. stock market. Not two-fifths. One-and-a-half times over.
That’s not a price target, and I’m not going to insult you by turning it into one. It’s a scale check. It tells you that gold — after a 65% year in 2025 and a run to $5,589 in January — is not some blown-out, over-owned, everybody’s-in-it asset when measured against the paper it competes with.
Gold looks expensive next to its own 2015 chart. It looks small next to the debt.
Now the Honest Part
I don’t ship a thesis without handing you the other side of the table, so here it is, and there’s more of it than usual.
Buybacks are not QE, and the people who tell you so have a real argument. Treasury is funding these purchases with bill issuance, not created money. The balance sheet is neutral. Debt managers have done liability management for decades, and the stated purpose — liquidity support in the long end — is a legitimate, boring plumbing objective. Call it what you like; I’m telling you the mechanical effect on long yields, not asserting a conspiracy.
And they’re small. Long-end buybacks total about $42 billion across all of 2026 against a Treasury market north of $30 trillion. That’s a rounding error in volume. The signal here is directional, not volumetric — Treasury has revealed what yield level it won’t tolerate. Don’t confuse a revealed preference with a bazooka.
The Fed is still leaning the wrong way for gold. Market-implied odds of a September hike are running near 31%. The odds of a cut are negligible. And Jackson Hole runs August 27–29, with Warsh expected to give his first address as chair that Friday morning. He can flip this tape hard in a single paragraph.
And gold itself is still convalescing. At $4,530 the metal is about 19% below its January 28 record of $5,589, and it’s up only about 5% on the year — hardly a moonshot. Silver near $64 is down roughly 9% in 2026 despite a monster 2025. This is a recovery inside a drawdown. Anyone selling you a clean breakout is selling you something.
Finally, my denominators are soft, and I’d rather say so than have you find out. Total U.S. equity market cap is an estimate, not a printed number — reasonable people land anywhere from $75 trillion to $86 trillion, which is the whole reason my 40% and Morris’s 37% disagree. And that 1.6x figure from the 1930s and 1970s is a peak-instant reading, not a level anything held; it also comes from markets with entirely different structure, ownership, and composition. Treat two-fifths versus 1.6x as an order-of-magnitude argument. It is not a precision instrument.
It’s Still Just Us
The crowd is watching the Fed’s calendar. It has been watching the Fed’s calendar all year, and it has been wrong all year — wrong in July when it dumped miners into single-digit breadth readings, wrong in August when it kept pricing a hike into a negative payroll print.
Meanwhile the actual policy shift got published as a schedule change on a Treasury webpage, in a PDF, in the middle of a week when everyone was busy parsing minutes.
That’s the tell.
Governments don’t announce the moment they start defending their own bond market. They just quietly widen the door and hope you’re looking somewhere else.
Two things happened this week that belong in the same sentence. The debt of the United States crossed $40 trillion, and the government of the United States doubled the rate at which it buys back its own long bonds. Gold is up on the year. Bitcoin — the asset that borrowed gold’s story — is down double digits over the same stretch, roughly 18% as I write this, and that’s after an 11% overnight rip.
You already own gold. That’s not the decision in front of you. The decision is whether you’re positioned for a decade in which the borrowing costs of the world’s reserve issuer become a permanent policy problem, because that decade started somewhere around Wednesday afternoon.
If you want to see how I’m playing the hard-asset cycle — including the income-paying positions that let you hold through drawdowns like this one without checking a screen every morning — that’s what I build every month in The Wealth Advisory. If today’s math resonates with you, that’s the logical next step.
The Fed will get its headline in September.
The easing already started.
To owning what’s real,
Jason Williams
Senior Investment Strategist, Gold World