

Dear Gold Digger,
There’s a number floating around the gold market right now that almost nobody is talking about.
It’s not the price of gold. It’s not the dollar index. It’s not the odds of a September rate hike — although we’ll get to all of those.
It’s 7.69%.
That’s the percentage of gold mining stocks that were still on Point and Figure buy signals as of last Friday, according to the Gold Miners Bullish Percent Index.
Think about that for a second… More than 92% of an entire sector has been sold down hard enough to flip its chart to a sell signal.
Readings like that don’t come around often. And when they do — and the sector turns — history says they mark the kind of entry you only get once or twice in an entire cycle.
A Census, Not a Chart
Here’s the thing most investors miss about the Bullish Percent Index…
It’s not a price indicator. It’s a census.
It doesn’t tell you what gold miners cost. It tells you how many of them are still standing. It counts the percentage of stocks in the group currently on a Point and Figure buy signal and stacks that against the sector’s own history of extremes.
When the reading sits above 70%, most of the group is already extended — already bought, already crowded, already priced for good news. There’s nobody left to buy.
When it sits below 10%, you get the mirror image: almost the entire sector has been liquidated. Everyone who wanted out is out. The weak hands are gone. The momentum chasers left months ago.
Football coaches call this field position. It doesn’t tell you who wins the game — but it tells you how far you have to drive for a touchdown.
And right now, gold miners are backed up against their own goal line at 7.69%.
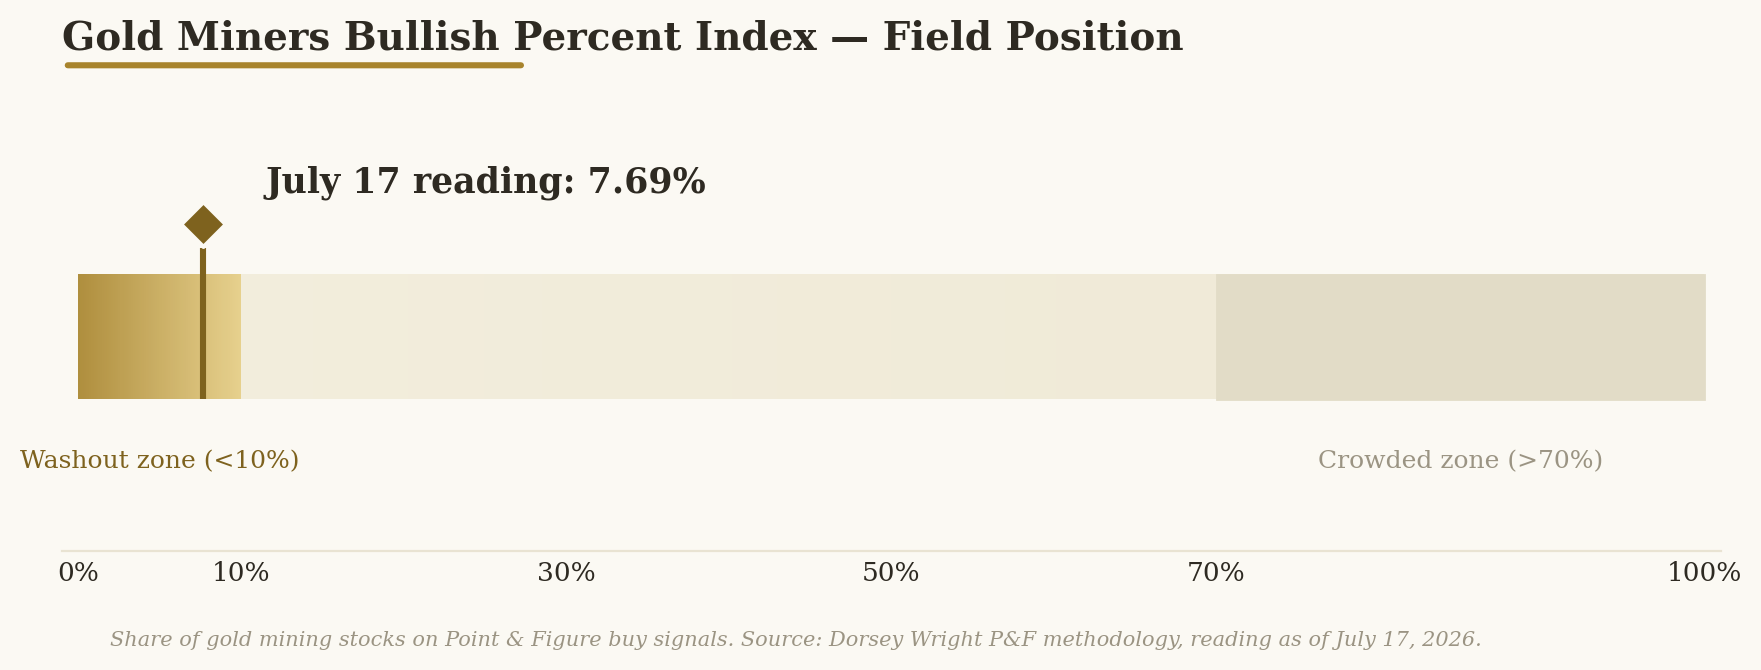
That’s not a level where bull markets die. That’s a level where they’re born.
Why the Crowd Left — and Why They’re Wrong to Stay Gone
Let’s be honest about why the sector got here, because the reasons are real.
Gold is trading around $4,100 an ounce as I write this — down roughly 28% from its January record. The dollar is sitting at 13-month highs. Two-year Treasury yields just punched to fresh multi-month highs. And money markets are pricing in roughly 77% odds that the Fed actually hikes rates in September.
Higher real yields and a stronger dollar are the two most reliable headwinds gold has. Both are pointed the wrong way at the same time.
So the crowd did what the crowd always does. They sold the metal, they dumped the miners twice as hard, and they moved on to whatever shiny narrative is dominating the financial media this week.
We’ve seen this movie before.
Back on July 10, I told you the plunge from the January highs was a head-fake — a violent repricing inside a structural bull market, not the end of one. Nothing that’s happened since has changed that view.
Here’s why…
The Buyer Who Never Left
While investors were stampeding out of gold, the most price-insensitive buyer on Earth kept right on buying.
Central banks purchased more than 1,000 tonnes of gold annually from 2022 through 2024, according to World Gold Council data. Even 2025 — a year of record-high prices — came in near 863 tonnes.
Compare that with the roughly 473 tonnes they averaged every year from 2010 through 2021.
Let that sink in… The world’s central banks have nearly doubled their pace of gold accumulation, held it for four straight years, and sustained it through both record highs and 28% drawdowns.
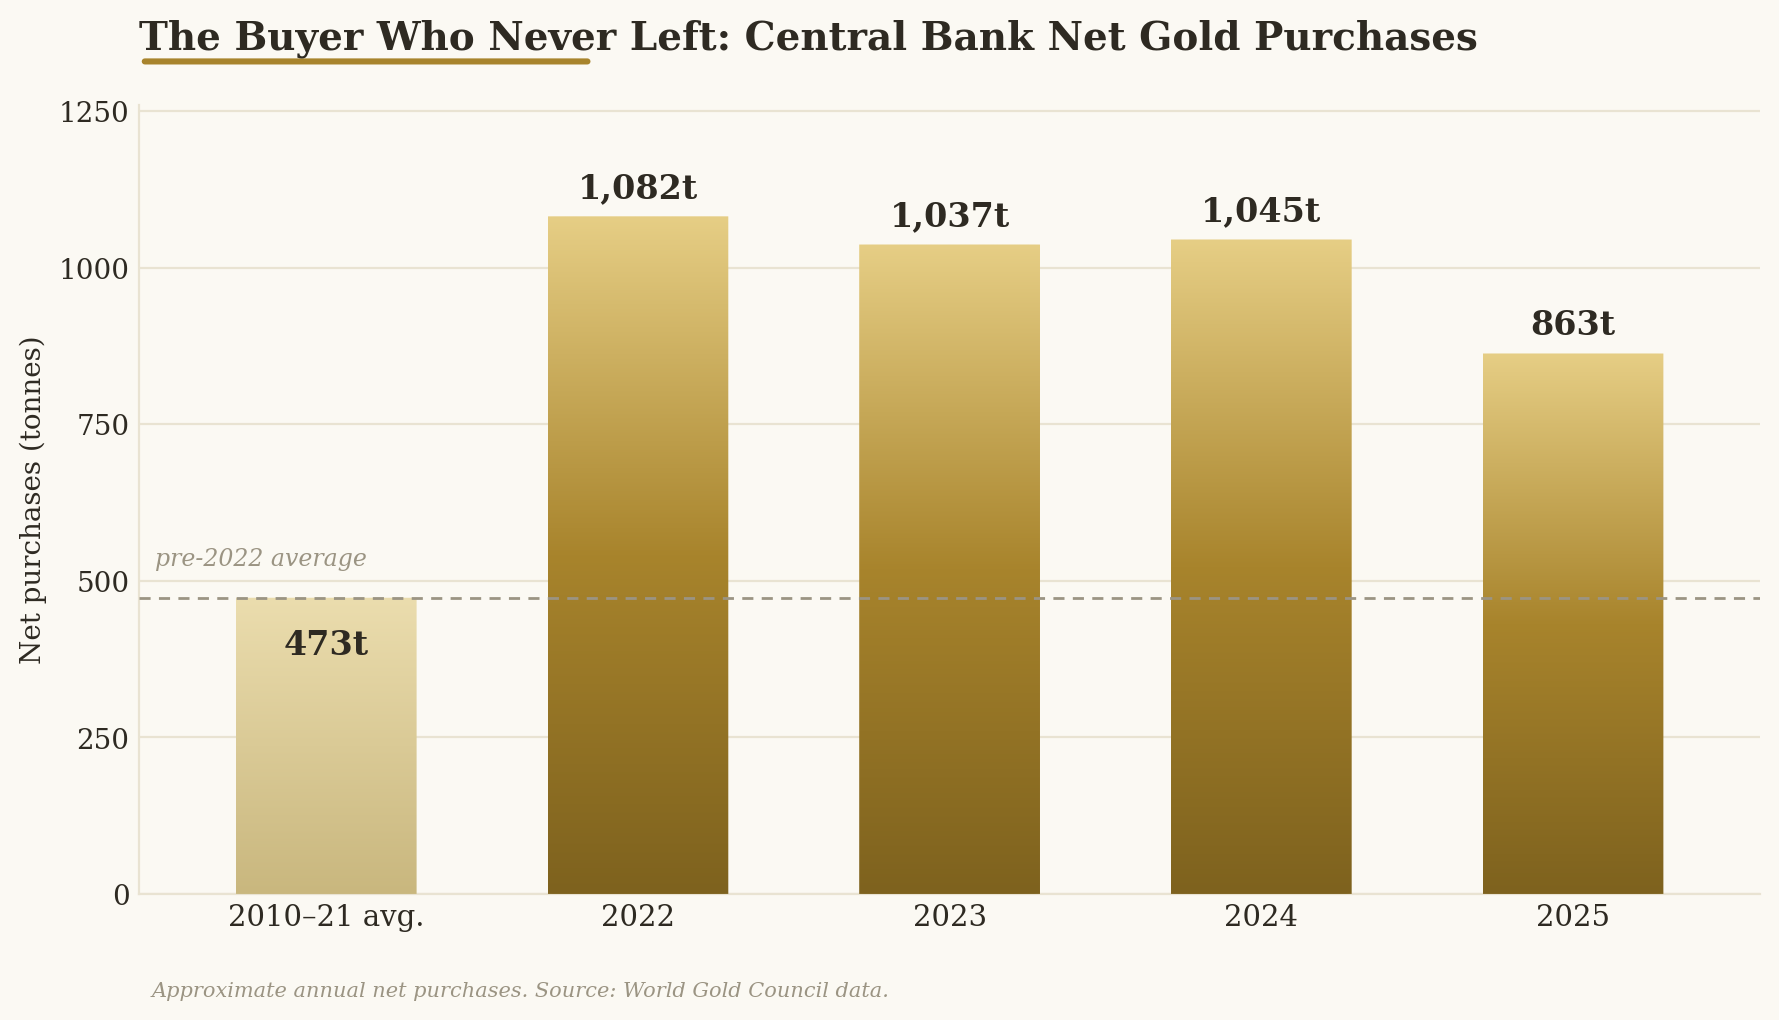
That’s not a trade. That’s a policy. It’s a multi-year demand floor under the metal that doesn’t care what the Fed says in September.
Now, I’ll give you the honest pushback, because that floor isn’t the whole picture…
Physical gold ETFs — the vehicle that reflects investor demand rather than sovereign reserve management — bled tonnes in May, and the redemptions continued into June. Central banks and retail investors are two different buyer bases, and right now they’re pulling in opposite directions.
But that’s exactly the point.
The sovereign buyers with unlimited balance sheets and 20-year time horizons are accumulating. The investors with CNBC subscriptions and itchy trigger fingers are fleeing.
When those two groups disagree, I know which side of the table I want to sit on.
The First Flicker
So the demand floor is intact and the sector’s field position is at a once-or-twice-a-cycle extreme. What’s been missing is the turn.
That may be what we just got.
On July 17, the Gold Miners Bullish Percent Index ticked up 0.10% from its lows. A token move, sure. But reversals from single-digit readings don’t start with fireworks — they start with a flicker.
Then, within days, two of the sector’s largest and most closely followed names confirmed Double Top Breakouts on their Point and Figure charts. Same signal. Same session. Two different tickers.
One stock catching a bid is noise.
An entire sector’s internals turning from single digits, followed almost immediately by confirmed breakouts in its most prominent names, is a different category of signal entirely.
That’s the tell.
Now, let me be equally blunt about what this isn’t: neither of those charts is breaking out into clear air. Both remain well below their 2026 peaks. This is a reversal inside a damaged sector, not a victory lap. If the Fed actually pulls the trigger on a September hike, gold could take another leg down, and a BPI turn from 7.69% doesn’t repeal the laws of macro gravity.
But here’s what history says about that risk…
The best entries in this sector have never come when the news was good. They’ve come when the news was terrible, the charts were broken, and the Bullish Percent Index was scraping single digits. By the time the macro turns friendly again — when the Fed blinks, when the dollar rolls over, when the headlines flip bullish — the reading will be back above 50% and the easy money will already be gone.
Low field position, then a turn. That’s when you get paid for being early instead of punished for being late.
History Keeps Score
If this setup feels familiar, it should — because we’ve seen this exact pattern before.
In late 2015, gold miners were the most hated group of stocks on the planet. Gold had been falling for four years. The Fed was raising rates. The dollar was ripping. Sector breadth had collapsed into single digits, and every respectable strategist on Wall Street had a “why we’re avoiding gold miners” slide in the deck.
Then the internals turned. Over the next seven months, the major gold mining indexes roughly doubled — while the metal itself gained a fraction of that.
Same story in late 2008. Miners were liquidated in the financial crisis alongside everything else, breadth washed out to historic lows, and the sector went on to become one of the best-performing groups in the market over the following two years.
Notice the pattern: in both cases, the macro news was still terrible when the bottom formed. The Fed hadn’t blinked yet. The headlines hadn’t turned. The only thing that changed first was breadth — the census, not the price.
That’s the cycle. And 7.69% is what the start of it has looked like before.
The Leverage Math the Sector Forgot
And don’t lose sight of what’s sitting underneath these miners at $4,100 gold.
The major producers’ all-in sustaining costs generally run in the $1,500–$1,800 per ounce range. Even after a 28% drawdown in the metal, these companies are clearing well over $2,000 an ounce in margin.
Think about that for a second… The sector is priced like it’s dying, while it’s earning some of the fattest margins in its history.
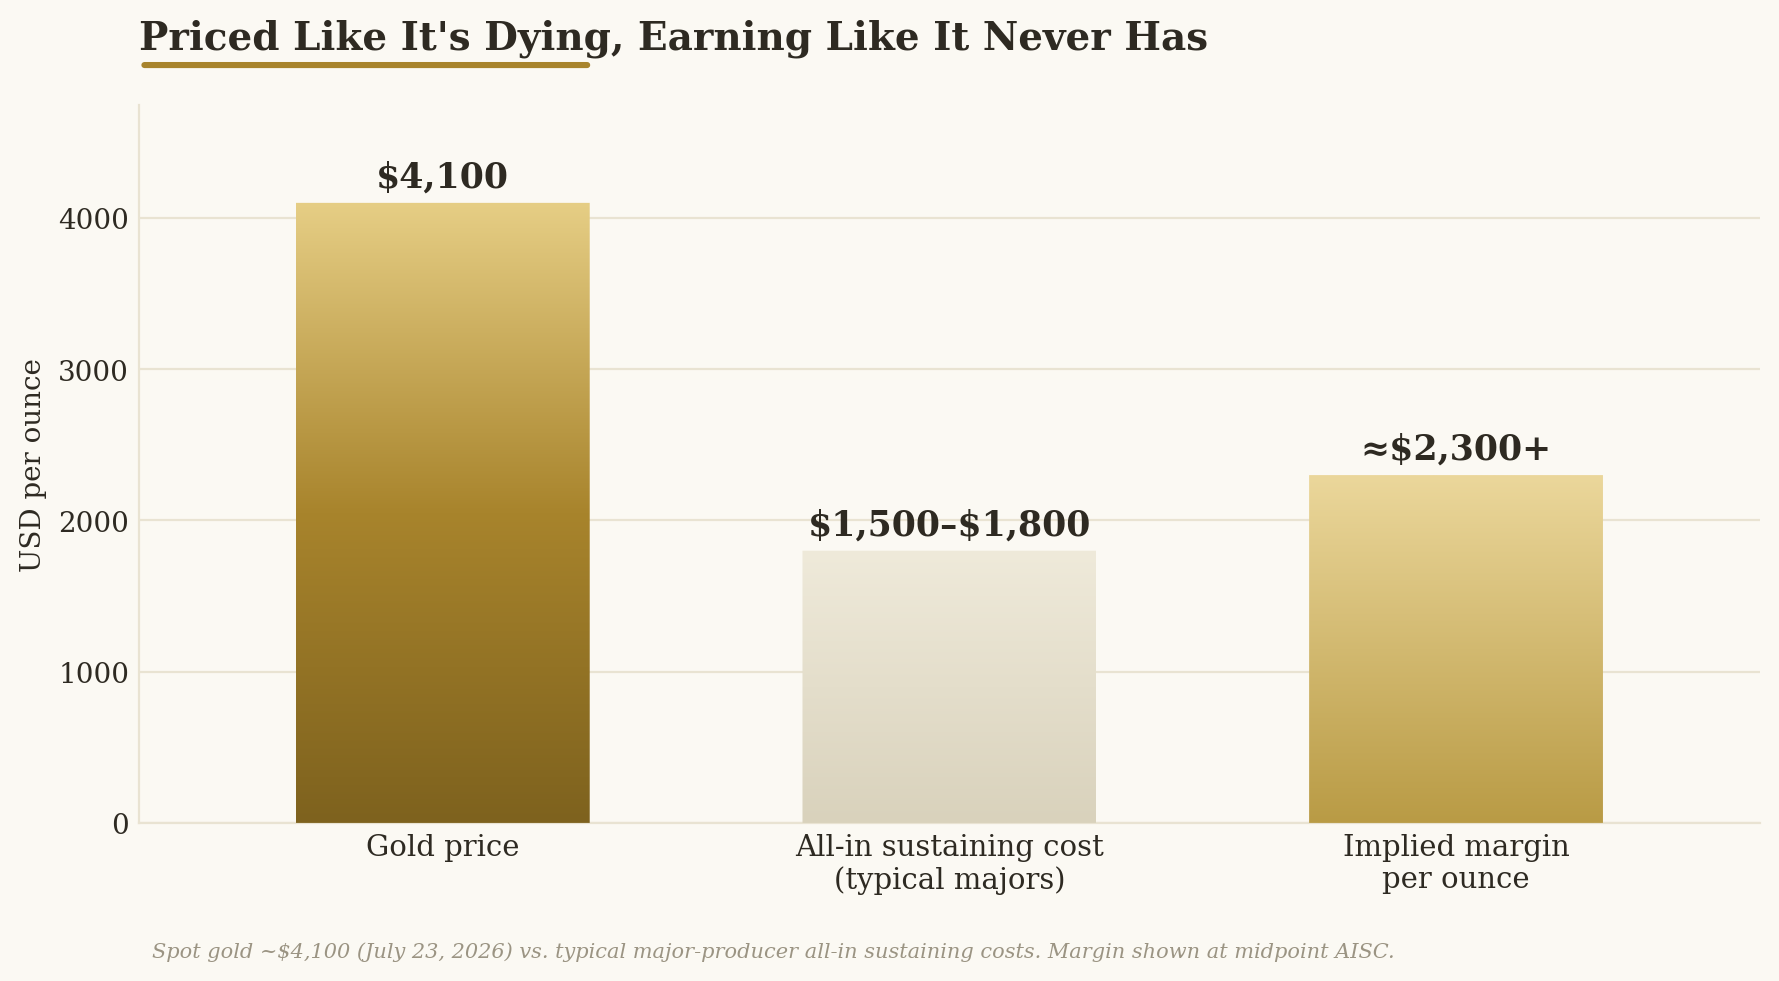
That’s the disconnect. Miners have been sold down to single-digit breadth readings not because the business broke, but because sentiment did.
And sentiment is the one input that can reverse overnight.
It’s Still Just Us
The mainstream isn’t watching breadth indicators on gold miners. They’re watching the Fed, the dollar, and the price — and all three are telling them to stay away.
That’s fine. That’s what the bottom of a cycle is supposed to look like. If the macro backdrop were friendly and the headlines were bullish, the Bullish Percent Index wouldn’t be at 7.69% — and the opportunity wouldn’t exist.
The crowd will show up eventually. They always do. They’ll pile in after the sector has already doubled off its lows, and they’ll call it a breakout.
You’ll know better. You were watching the census while they were watching the noise.
So here’s my read: the metal’s demand floor is sovereign and structural, the sector’s field position is at a generational extreme, and the internals just flickered for the first time in months. Nobody can promise you the turn sticks — but setups like this have historically been where the sector’s biggest moves begin.
Get your watchlist built now, while it’s still just us.
And if you want to see how I’m positioning for the broader hard-asset cycle — including the income-generating plays that let you ride this volatility without losing sleep — that’s exactly what I do every month in The Wealth Advisory. If today’s thesis resonates with you, that’s the logical next step.
The shakeout was the setup. The flicker might be the signal.
To owning what’s real,
Jason Williams
Senior Investment Strategist, Gold World