

Dear Gold Digger,
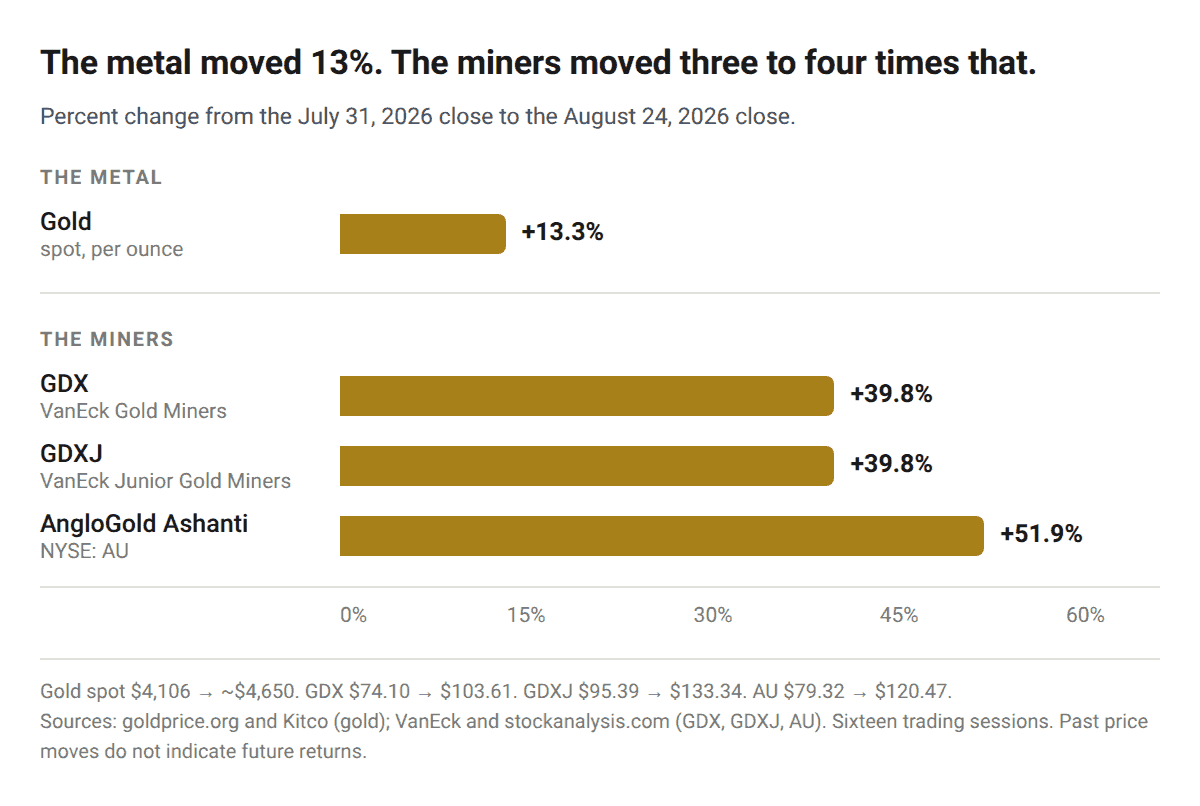
On July 31, the VanEck Gold Miners ETF closed at $74.10. Yesterday it closed at $103.61.
The Junior Gold Miners ETF went from $95.39 to $133.34 over the same stretch. AngloGold Ashanti went from $79.32 to $120.47. Gold itself went from $4,106 an ounce to roughly $4,650 as I write this Tuesday morning.
Do the math and you get gold up about 13%, the miners up somewhere between 40% and 52%, in sixteen trading days.
Those are exchange prices on public tickers, not results from any portfolio I run. They’re the cleanest measure there is of what happens to a miner’s equity when the metal it sells moves.
And the sector that just did it is, by the only measure that matters to a business owner, cheaper today than it has been in more than a decade.
What We Said at Zero
Back on July 23, I wrote you about a number nobody in the financial press was talking about: the Gold Miners Bullish Percent Index, scraping single digits.
That index doesn’t measure price. It takes a census. It counts what percentage of gold mining stocks are still sitting on a Point and Figure buy signal, meaning how many of them are still standing.
In June, it printed a zero.
Not “near zero.” Zero. On June 9, the index that counts how many gold miners the market still believed in came back with none of them. It was still under 20 in the middle of July, when I told you the crowd had positioned itself entirely around the Fed’s calendar, and that the Fed’s calendar was going to be the least important thing on the page.
What I said then was that the shakeout was the setup, and the flicker might be the signal.
I don’t get to say that often. It was.
What’s left is the disconnect, and it’s still sitting in plain sight.
The Leverage Wasn’t a Theory Anymore
Every gold-miner bull case ever written contains some version of this sentence: “Because costs are relatively fixed, a 10% move in the metal produces a much larger move in the miner’s profit.”
It’s true. It’s also the most abused sentence in this sector, because for a decade it was a hypothetical that never reached an income statement. Costs ran away, capital got wasted, and management teams diluted shareholders into oblivion chasing production instead of profit.
This time it showed up.
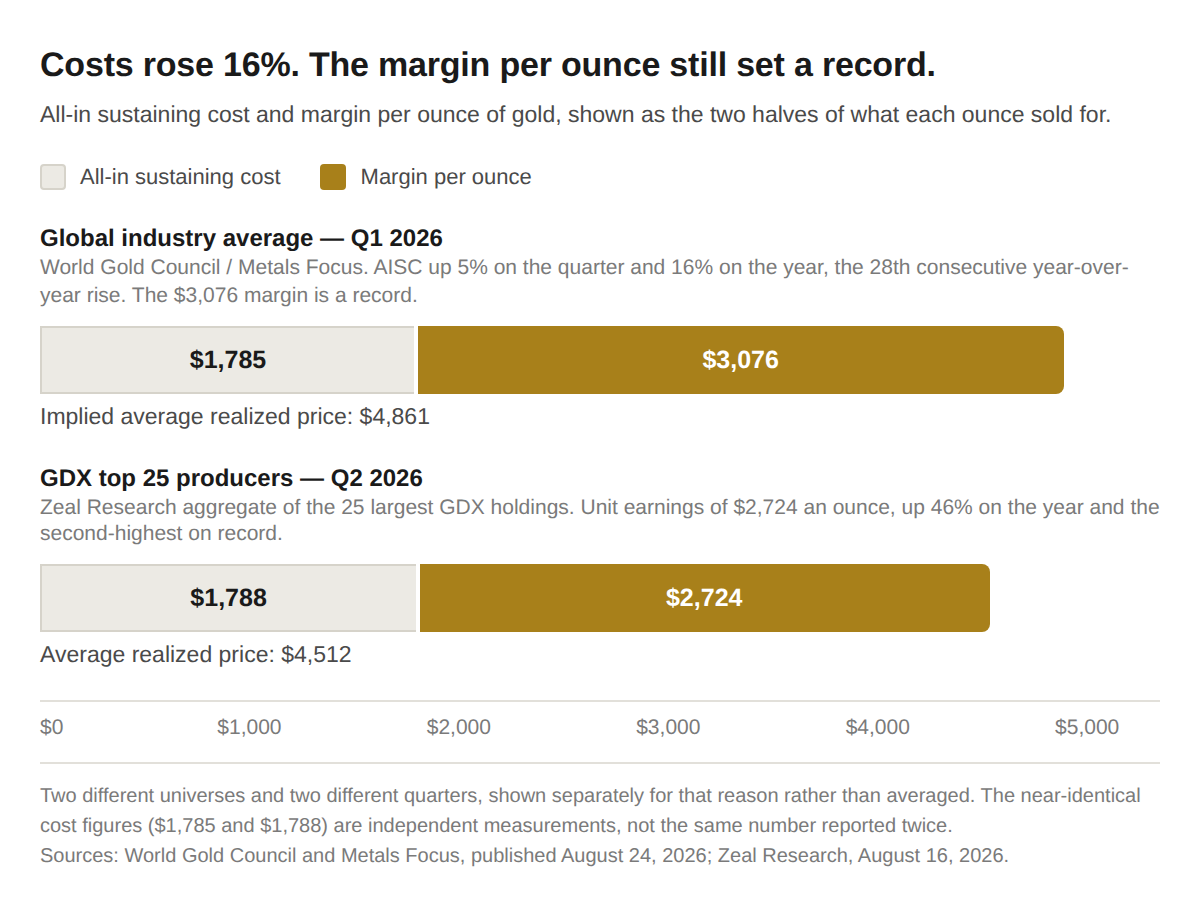
The World Gold Council and Metals Focus published their latest mine cost data yesterday. Global average all-in sustaining costs for the first quarter of 2026 came in at $1,785 an ounce, up 5% from the prior quarter and up 16% year over year, the twenty-eighth consecutive year-over-year increase.
Costs are rising. That part gets left out of most bull cases.
And the average AISC margin still hit a record $3,076 an ounce.
That’s what happens when the metal outruns the cost curve for four straight years. The miners didn’t get efficient. Gold got expensive faster than mining did.
Then the earnings landed:
- Newmont posted $2.2 billion of free cash flow in the second quarter, a record for any second quarter in the company’s history.
- Agnico Eagle posted record quarterly free cash flow of $1.34 billion and returned a record $625 million to shareholders in a single quarter.
- AngloGold Ashanti generated $727 million of free cash flow in Q2 and $1.9 billion for the first half, paid out $949 million in dividends, and had shareholders approve a $2 billion buyback in July.
- Barrick beat its own production guidance and grew adjusted earnings per share 74% year over year.
Across the twenty-five largest holdings in GDX, second-quarter revenues came in about 50% higher than a year ago and net earnings about 62% higher, according to Adam Hamilton’s quarterly tally at Zeal Research.
Think about that for a second… This is a sector that spent the first half of 2026 being liquidated to a zero breadth reading while printing the second-best unit earnings in its recorded history.
The Part That Still Makes No Sense
So the miners rallied 40%. Fine. That’s the sector catching up to its own income statement.
The multiple is what I can’t reconcile.
After a 40% move and a record margin quarter, Hamilton’s read on the trailing price-to-earnings multiple of the GDX majors is about 16.5x. The GDXJ mid-tiers come in near 16.1x, which he calculates as the cheapest the group has been in at least the last 41 quarters.
Forty-one quarters. More than ten years. After a 40% rally.
It’s arithmetic. Earnings grew faster than the share prices did, and you can have a violent rally and a cheapening sector at once if the profits move faster than the crowd.
Bank of America ran a different version of this math back in June and got to the same place from a different direction. Gold equities were trading at roughly a 19% discount to net asset value, which implied the market was pricing gold at about $3,354 an ounce while the metal sat at $4,156.
Gold is $500 higher than it was when they wrote that.
The market is still refusing to underwrite the price on the screen. It always does this. It underwrites the price it remembers.
Why It Turned in August and Not in June
Nothing about a mining company changed between June 9 and today. What changed is the tape underneath it.
Gold pushed through its 200-day moving average around $4,513 on Friday and hasn’t looked back, clearing $4,692 on Monday, its highest level in more than three months.
The macro fuel is the same fuel I walked you through on Thursday. Total U.S. public debt outstanding stood at $40.03 trillion on August 20, and the Treasury is doubling the size of its long-end bond buybacks starting September 9. The short version: a government quietly widening the exit door on its own thirty-year paper is telling you something about what it can afford to pay in interest.
And the buyer base is turning back up. Physically backed gold ETFs took in $3.0 billion in July and added 23 tonnes to reach 4,068 tonnes, per World Gold Council data, reversing two straight months of redemptions. Central banks bought 289 tonnes in the second quarter, a record for any second quarter and 62% more than the same quarter last year, led by Poland at 51 tonnes and the People’s Bank of China at 33.
The World Gold Council’s own survey of 76 central banks, published in June, found 45% of them expect to add to their own gold reserves over the next twelve months. That’s the highest reading in the nine years they’ve run the survey.
Now the Honest Part
There’s a lot on the other side of this one.
The central bank number cuts both ways. Intentions hit a record, but the buying in the first half of 2026 came to 345 tonnes, the weakest first half since 2022. Q2 was a monster, but the World Gold Council revised Q1 down from an initial 244 tonnes to just 57. Anyone quoting the record 45% without that revision is selling you half a picture.
The cost trend is the risk. Twenty-eight straight quarters of year-over-year AISC increases is a trend, and royalties alone were up 85% year over year. Those record margins exist because the gold price outran the cost curve. If gold flatlines here, that spread compresses on its own, no bear market required.
The multiple is a trailing multiple. That 16.5x is priced off a quarter in which the majors realized an average $4,512 an ounce. It promises nothing about the next four. If the metal gives back its August gains, the “cheap” P/E re-rates upward without a single share changing hands.
Gold is still convalescing. At $4,650 the metal is roughly 17% below its January 28 record of $5,589 and up only about 7% on the year. Silver near $68 is down on 2026 despite a monster August. This is a recovery inside a drawdown, not a breakout to blue sky.
And the Fed is still leaning the wrong way. Market-implied odds of a September hike are running near 36%. Odds of a cut are roughly one percent. Jackson Hole opens Thursday, Kevin Warsh is expected to give his first address as chair on Friday morning, and the July PCE print lands tomorrow. Any one of those can put a hole in this tape by the weekend.
And the timing. Sixteen trading days of 40% gains is a move that already happened. The whole argument I made in July was about buying field position when nobody wanted it, and the consequence of being right is that the field position is worse now than it was a month ago. If you weren’t there at zero, the trade in front of you today is not the trade that was in front of you then.
The Other Way to Own the Leverage
Strip everything above down and it’s one idea wearing a mining company’s clothes: when gold moves, the thing that owns gold moves further.
A miner hands you that leverage through the income statement. It also hands you a diesel bill, a grade problem, a labor negotiation, a permitting queue, and a country risk you never asked for. That’s the toll you pay for the margin, and it’s why a record $3,076 an ounce still only bought the sector a 16x multiple.
There’s another way to hold ounces in the ground without any of it, one we’ve followed here since launch day.
NatGold’s NATG token is tokenized in-ground gold resource: ounces certified where they sit and never dug up. On July 31, the exact day gold bottomed at $4,106, NATG printed its all-time low of $2,217. This morning it printed its all-time high near $2,826, and last traded around $2,750.
Same starting line. Gold up 13%. NATG up roughly 24%.
That’s the leverage story the miners just told you, from an asset with no payroll and no cost curve to outrun.
NATG trades on essentially one venue, MEXC, with High Ridge Trust handling custody for eligible U.S. buyers and 677 Financial covering institutions. Daily volume is running near $19,000 against a fully diluted valuation around $293 million.
That is a very small door on a very large room.
A price that jumps 24% in a month on that kind of volume is telling you at least as much about the order book as about gold. It’s an early-stage, thinly traded asset, and anyone who buys it should size it like one.
It’s Still Just Us
The mainstream showed up for gold this week. You’ll see the coverage: three-month highs, Fibonacci levels, price targets getting walked back up. Wells Fargo cut its year-end target to $4,900–$5,100 on August 18, and gold spent the following three sessions charging at the bottom of that band.
That’s the tell. The people who set the targets are revising toward the price instead of ahead of it.
The opportunity is in what those businesses just reported. Record margins, record free cash flow, 50% revenue growth, and a valuation that still assumes gold is going back to $3,300.
The crowd will eventually notice. They always do. They’ll notice around the time the Bullish Percent Index is back above 70 and every analyst on television has a gold miner slide in the deck.
You were reading the census while they were reading the price.
And if you’ve spent four months reading about NatGold without ever quite pinning down the mechanics of actually buying the thing, the U.S. path versus the non-U.S. path, who holds custody, what the price is even tracking, we finally put the whole walkthrough in one place:
How to Buy the #1 Gold Token: NatGold »
No opt-in, no paywall. Just the steps, in order.
The shakeout was the setup. The flicker was the signal.
Now the sector has to earn the multiple.
To owning what’s real,
Jason Williams
Senior Investment Strategist, Gold World